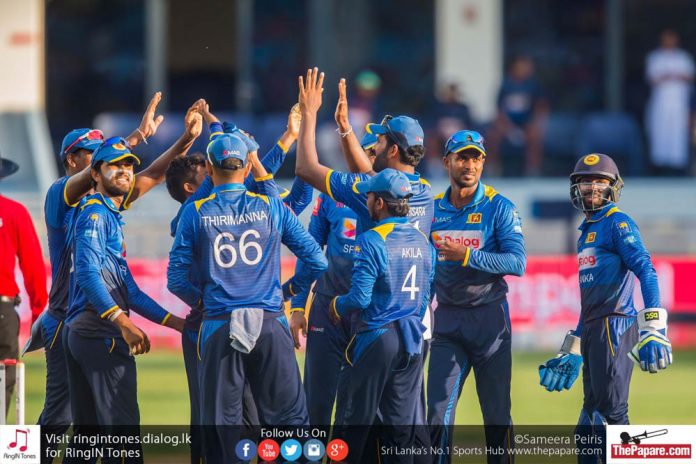
Bowling in 50-over cricket, or more commonly ODIs is an ‘Art’. Though it is not as hard or tiring as bowling in a Test, it alone demands a bowler to possess a set of distinct skills.
In Test cricket the requirement is pretty clear; pick up wickets (yes, there are exceptions) – which is obviously the harder thing. But in ODIs the requirement varies according to the situation of the game. At times its just to restrict runs while at times it is all about picking up wickets.
Before the 2015 ICC World Cup and also throughout the World Cup, bowling was just a nightmare to anyone who got the ball in his hands. Even the best in the job easily went for more than 6 runs per over. But with the change of rule from the 5th of July (after the WC), life became less difficult for the bowlers.
Why the previous rule didn’t help the bowlers was because only 4 fielders were allowed outside the circle in the last 10 overs and the existence of a batting power play which was usually taken between the 36th and the 40th over. It was also a rule to have two catching fielders in the first 10 overs.
Read : Sri Lankan Test Bowlers’ stats in the past 5 years – Let’s Talk Numbers
Luckily for the bowler after the 5th of July the annoying batting powerplay and the rule to have 2 catching fielders in the first 10 overs were scrapped. Also an extra fielder is allowed outside the circle in the last 10 overs.
The below table shows how each team has fared in ODIs in terms of bowling since the 2015 World Cup. Unfortunately Sri Lanka is the team with the highest average and the highest economy rate.
| Team | No. of bowlers | Mat | Mdns | Wkts | Ave | Econ | SR |
| Afghanistan | 33 | 47 | 108 | 353 | 24.20 | 4.48 | 32.3 |
| New Zealand | 34 | 57 | 87 | 401 | 32.72 | 5.32 | 36.8 |
| India | 41 | 59 | 86 | 421 | 32.75 | 5.24 | 37.4 |
| Pakistan | 39 | 49 | 69 | 346 | 32.76 | 5.16 | 38.0 |
| South Africa | 32 | 53 | 80 | 364 | 33.11 | 5.40 | 36.7 |
| Bangladesh | 29 | 34 | 42 | 220 | 33.30 | 5.15 | 38.7 |
| Ireland | 22 | 39 | 71 | 277 | 33.56 | 5.17 | 38.9 |
| Australia | 42 | 60 | 80 | 446 | 34.08 | 5.59 | 36.5 |
| Zimbabwe | 40 | 63 | 118 | 377 | 34.44 | 4.91 | 42.0 |
| England | 27 | 66 | 93 | 466 | 35.48 | 5.54 | 38.3 |
| West Indies | 39 | 46 | 59 | 263 | 39.96 | 5.42 | 44.2 |
| Sri Laka | 49 | 64 | 85 | 354 | 40.43 | 5.65 | 42.9 |
Sorted by Average
The post-World Cup era is something every Sri Lankan would like to forget and not talk about. It is such a disastrous era as Sri Lanka has lost 39 out of 64 ODIs. Their bowling has let them down in most of the lost matches.
As Sri Lanka prepare for a crucial ODI series beginning preparations for next year’s World Cup, here is a statistical analysis of Sri Lanka’s ODI bowling since the 2015 ICC World Cup.
Comparing Sri Lankan bowling figures with that of rest of the world
| Wickets per inning | ||
| Bowling first | Defending | |
| Sri Lanka | 6.5 | 4.82 |
| Rest of the World | 7.4 | 6.57 |
| Bowling average | ||
| Bowling first | Defending | |
| Sri Lanka | 37.77 | 43.69 |
| Rest of the World | 33.77 | 31.89 |
| Economy rate | ||
| Bowling first | Defending | |
| Sri Lanka | 5.71 | 5.59 |
| Rest of the World | 5.26 | 5.13 |
In every aspect the Sri Lankan bowling figures seems to be way below that of rest of the world.
Numbers by phase of innings
Phase 1 (Overs 1 – 10)
| Bowling first | Defending | |
| Best | 11/3 v Ind | 26/3 v Ban |
| Worst | 75/3 v NZ | 118 v NZ |
| Run Rate | 4.72 | 5.73 |
| Average | 47/1 | 58/1 |
Phase 2 (Overs 11 – 40)
| Bowling first | Defending | |
| Worst | 217/4 v Ind | 244/3 v Eng |
| Run Rate | 5.70 | 5.56 |
Phase 3 (Overs 41 – 50)
| Bowling first | Defending | |
| Run Rate | 8.97 | 10.75 |
Interestingly Sri Lanka have bowled well in the first 10 overs when bowling first and in the middle overs when defending. Sri Lanka’s numbers in the death overs clearly depicts the lack of quality death bowlers. Lasith Malinga’s decline of form and most of the time not being picked in the squad might also have resulted in this poor stat.
Spin v Pace
| Spin | Pace | |
| No. of wickets | 131 | 223 |
| Percentage of overs bowled | 41% | 59% |
| Economy rate | 5.64 | 5.65 |
| Bowling average | 45 | 37.62 |
Surprisingly the spinners have performed poorer than the pacers. Sri Lanka with a reputation of producing quality spinners irrespective of the format of the game should really address this issue before the next World Cup. Just looking at the numbers, the only spinner who stands out to have performed well is Akila Dananjaya, on whom Sri Lanka will depend a lot in the coming assignments.
Team Performances
Lowest conceded score
- Ban 82 – Dhaka, 2018
- India 112 – Dharamsala, 2017
- Bangladesh 142 – Dhaka, 2018
- Highest conceded score
- India 392/4 – Mohali, 2017
- South Africa 384/6 – Centurion, 2017
- India 375/5 – R. Premadasa, 2017
Individual Performances
Most Wickets
- Suranga Lakmal – 47 in 40 matches (Average 32.57, Economy 5.16)
- Nuwan Pradeep – 30 in 26 matches (Average 39.06, Economy 5.90)
- Thisara Perera – 30 in 29 matches (Average 32.8, Economy 5.95)
- Asela Gunaratne – 22 in 29 matches (Average 30.81, Economy 5.21)
- Akila Dananjaya – 21 in 18 matches (Average 37, Economy 4.97)
Best Average (Minimum 10 innings)
- Asela Gunaratne – 30.81 (23 innings)
- Angelo Mathews – 31.05 (25 innings)
- Nuwan Kulasekara – 32.11 (15 innings)
- Best economy (Minimum 10 innings)
- Angelo Mathews – 4.81 (25 innings)
- Akila Dananjaya – 4.97 (17 innings)
- Dushmantha Chameera – 4.98 (17 innings)
Most 4+ wicket hauls
Akila Dananjaya & Suranga Lakmal 2 each
Amila Aponso, Lahiru Gamage, Nuwan Kulasekara, Thisara Perera, Lakshan Sandakan & Dasun Shanaka 1 each
Best Bowling in an Inning
- Akila Dananjaya 6/54 v India – Pallekale, 2017
- Dasun Shanaka 5/43 v Ireland – Dublin, 2016
- Suranga Lakmal 4/13 v India – Dharamsala, 2017
- Amila Aponso 4/18 v Australia – R. Premadasa, 2016
- Thisara Perera 4/33 v Zimbabwe – Dhaka, 2018


