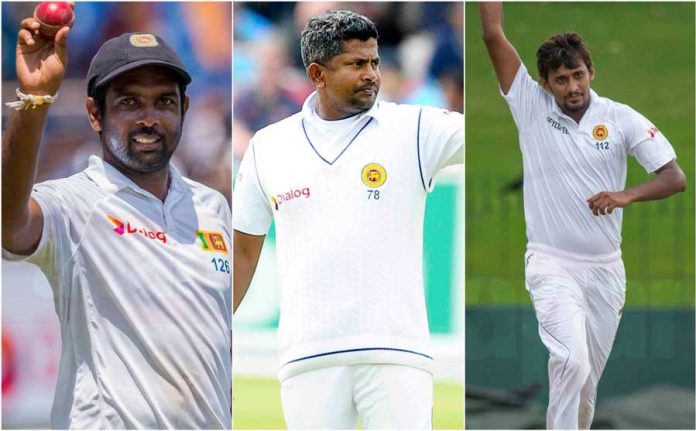
To win a Test match what should a team do? – Score more than 500? – You can win a Test even scoring less than 500. Then what should a Test team compulsorily do to win a Test match? The answer is take 20 wickets. So the answer for the question, “Who wins Test matches for a team?” would undoubtedly be bowlers! It was evident in the recently concluded Sri Lanka tour of West Indies. So this edition of Let’s Talk Numbers is dedicated to talking about Sri Lankan bowling stats from the past 5 years.
Comparison with other Test playing nations
The main measure of the quality and consistency of a Test bowling outfit is the no. of instances they’ve taken all 20 wickets in a game. When their numbers are compared with other Test bowling outfits of the same era it would be easy to come to a conclusion whether the bowlers have done well or not.
| Team | Matches | Instances they’ve taken 20 wickets | No. of bowlers | Wickets | Strike Rate | |
| Number | Percentage | |||||
| England | 69 | 33 | 47.83 | 43 | 1112 | 61.9 |
| Australia | 61 | 34 | 55.74 | 28 | 1036 | 58.8 |
| India | 53 | 32 | 60.38 | 27 | 891 | 57 |
| Sri Lanka | 52 | 21 | 40.38 | 34 | 826 | 64.2 |
| South Africa | 48 | 30 | 62.50 | 28 | 789 | 51.2 |
| New Zealand | 47 | 22 | 46.81 | 21 | 766 | 64.3 |
| West Indies | 45 | 12 | 26.67 | 27 | 593 | 69.6 |
| Pakistan | 42 | 22 | 52.38 | 28 | 692 | 65.6 |
| Bangladesh | 31 | 9 | 29.03 | 34 | 402 | 77.3 |
| Zimbabwe | 18 | 3 | 16.67 | 27 | 247 | 77.5 |
Looking at the percentage of instances Sri Lanka have taken 20 wickets, they are ranked 7th among the 10 nations who have played Tests during the past 5 years. Their Strike Rate is 5th in the world.
Classification of wickets taken
Spin v Pace
The numbers prove the belief that Sri Lanka’s strength is spin bowling. But surprisingly, the pacers aren’t too far behind in terms of the numbers.
| Spin | Pace | |
| No. of Wickets | 441 | 385 |
| Percentage of overs bowled | 51.69 | 48.31 |
| Strike Rate | 62.1 | 66.6 |
In Asia v Outside Asia
The number of wickets taken in and outside Asia is more or less proportional to the number of matches played in the two regions. The Strike Rate of Sri Lanka’s bowlers in Tests played in Asia is slightly higher than when playing outside Asia.
| In Asia | Outside Asia | |
| No. of matches | 35 | 17 |
| No. of Wickets | 569 | 257 |
| Strike Rate | 63.5 | 65.9 |
Against various opponents
During the past 5 years Sri Lankan Test bowlers seem to have done really well against Australia. Sri Lanka not touring Australia during the past 5 years might have affected the impressive Strike Rate shown in the below chart.
| Opponent | No. of matches | No. of Wickets | Strike Rate |
| Pakistan | 10 | 166 | 63.6 |
| Bangladesh | 8 | 130 | 63.5 |
| India | 9 | 124 | 73.5 |
| West Indies | 5 | 86 | 53.6 |
| England | 5 | 74 | 71.1 |
| South Africa | 5 | 74 | 76.5 |
| Zimbabwe | 3 | 60 | 54 |
| Australia | 3 | 58 | 43.5 |
| New Zealand | 4 | 54 | 71.0 |
Impact of bowlers towards winning matches
Bowlers who have played in more than 5 Tests during the past 5 years have been selected in this measure. The number of wickets taken and the Strike Rate of each bowler in the matches Sri Lanka have won are as follows.
| Bowler | Total number of matches played | Number of won matches | Wickets in won matches | S.R in won matches |
| Rangana Herath | 45 | 20 | 156 | 39.4 |
| Suranga Lakmal | 34 | 12 | 35 | 60.8 |
| Dilruwan Perera | 29 | 15 | 67 | 51.2 |
| Angelo Mathews | 42 | 14 | 8 | 78.7 |
| Nuwan Pradeep | 24 | 8 | 17 | 76.4 |
| Shaminda Eranga | 14 | 5 | 18 | 68.3 |
| Dammika Prasad | 13 | 7 | 28 | 45.6 |
| Lahiru Kumara | 12 | 5 | 14 | 65.3 |
| Lakshan Sandakan | 9 | 5 | 11 | 75.6 |
| Tharindu Kaushal | 7 | 3 | 14 | 47.7 |
| Dushmantha Chameera | 6 | 1 | 4 | 43.2 |
Unsurprisingly, Rangana Herath clearly the bowler with the most impact towards Sri Lanka’s Test victories. Apart from Herath, Dammika Prasad stands out as a bowler who has a huge impact towards Sri Lanka’s success when he is playing.
Records
Highest total against Sri Lanka (Top 3)
- Bangladesh 638 – Galle, 2013
- India 622/9d – SSC, 2017
- India 610/6d – Nagpur, 2017
Lowest total against Sri Lanka (Top 3)
- Windies 93 – Barbados, 2018
- Australia 106 – Galle, 2016
- Bangladesh 110 – Dhaka, 2018
Most Wickets (Top 5)
- Rangana Herath – 232 wickets in 85 innings (S.R – 57.1)
- Dilruwan Perera – 109 wickets in 54 innings (S.R – 66.3)
- Suranga Lakmal – 94 wickets in 65 innings (S.R – 73.5)
- Nuwan Pradeep – 67 wickets in 45 innings (S.R – 66.2)
- Dammika Prasad – 53 wickets in 26 innings (S.R – 47.3)
Most no. of Overs (Top 5)
- Rangana Herath – 2209.5 Overs in 85 innings (Avg – 26.90)
- Dilruwan Perera – 1204.3 Overs in 54 innings (Avg – 35.73)
- Suranga Lakmal – 1151.4 Overs in 65 innings (Avg – 36.81)
- Nuwan Pradeep – 740.1 Overs in 45 innings (Avg – 37.76)
- Shaminda Eranga – 491.1 Overs in 26 innings (Avg – 37.33)
Most no. of 5-wicket hauls (Top 3)
- Rangana Herath – 19 in 85 innings
- Dilruwan Perera – 5 in 54 innings
- Tharindu Kaushal – 2 in 14 innings
- Dushmantha Chameera, Akila Dhananjaya, Nuwan Pradeep, Lahiru Kumara, Suranga Lakmal, Ajantha Mendis, Dammika Prasad & Lakshan Sandakan 1 each.
Most no. of 10-wicket hauls (Top 2)
- Rangana Herath – 7
- Diruwan Perera – 1
BBI (Top 5)
- Rangana Herath – 9/127 v Pakistan – SSC, 2014
- Rangana Herath – 8/63 v Zimbabwe – Harare, 2016
- Rangana Herath – 7/48 v India – Galle, 2015
- Rangana Herath – 7/64 v Australia – SSC, 2016
- Rangana Herath – 7/89 v Bangladesh – RPS, 2013
BBI [Fast Bowlers] (Top 5)
- Lahiru Kumara – 6/122 v South Africa – Cape Town, 2016/17
- Nuwan Pradeep – 6/132 v India – Galle, 2017
- Dushmantha Chameera – 5/47 v New Zealand – Hamilton, 2015/16
- Dammika Prasad – 5/50 v England – Leeds, 2014
- Suranga Lakmal – 5/63 v South Africa – Port Elizabeth, 2016/17
BBM (Top 5)
- Rangana Herath – 14/184 v Pakistan – SSC, 2014
- Rangana Herath – 13/145 v Australia – SSC, 2016
- Rangana Herath – 13/152 v Zimbabwe – Harare, 2016
- Rangana Herath – 12/157 v Bangladesh – RPS, 2013
- Rangana Herath – 11/136 v Pakistan – Abu Dhabi, 2017
BBM [Fast Bowlers] (Top 5)
- Dushmantha Chameera – 9/115 v New Zealand – Hamilton, 2015/16
- Dammika Prasad – 8/169 v India – SSC, 2015
- Suranga Lakmal – 7/119 v India – Kolkata, 2017
- Dammika Prasad – 7/135 v Pakistan – PSS, 2015
- Lahiru Kumara – 7/135 v Windies – Trinidad, 2018


