
We are passionate lovers of cricket. We follow our team in ups as well as in downs. However, we have come across more downs than ups in recent years. Especially in T20Is.
Free Hit Contributor – Thushan Perera
I decided to crunch numbers to identify what is the wrong with our T20I team. I have identified three key areas where we are other teams, which have resulted in more losses than wins.
Winning at Home
Overall Sri Lanka has played 128 T20Is, winning 60 of them and losing 66 matches; 2 matches ended with no result.
Surprisingly, Sri Lanka has not done well in Sri Lanka. Out of 42 T20Is played at home, Sri Lanka won only 16 and lost 25 matches. This stat gets even worse in the last 10 T20Is at home where Sri Lanka have won only 2.
Pallekelle is by far the best ground for Sri Lanka in T20Is and only ground where they have a win percentage over 50%. Out of 16 wins at home, 9 of them have been won at the Pallekelle International Stadium.
5 defining moments of Sri Lanka Cricket
Cricket brings us memories to savor for ages. Some occasions are still as fresh as a daisy.
Last time Sri Lanka won 4 consecutive T20Is at home was in 2012 and 3 of those wins came in Pallekelle. The last time they won 2 consecutive T20Is at home was in 2013 and those games were held in Pallekelle and Hambantota, respectively.
| Ground | Matches | Win | Lost | NR | % |
| Pallekelle | 16 | 9 | 6 | 1 | 56.25 |
| R. Premadasa | 20 | 4 | 16 | 0 | 20.00 |
| Hambantota | 6 | 3 | 3 | 0 | 50.00 |
The first challenge for Sri Lanka is to start winning at home regularly. This will boost their morale as well as ease the pressure on players.
Not Enough Runs
Since 01 January 2019, Sri Lanka played 18 T20Is and used 27 players. Our batsmen scored 2,304 runs (excluding extras) at 17.06 with a strike rate of 117.37. These runs include only 8 half centuries.
Among 12 test playing nations, the lowest strike rate is Sri Lanka’s 117.37 during the considered time and the lowest batting average also Sri Lanka’s 17.06.
| Team | Matches | Innings | Runs | Average | SR | 100 | 50 | Balls per Dismissal |
| Australia | 11 | 58 | 1567 | 43.52 | 141.2 | 2 | 11 | 30.83 |
| India | 24 | 161 | 3616 | 31.44 | 135.9 | 0 | 24 | 23.14 |
| England | 12 | 89 | 1987 | 29.22 | 152.1 | 1 | 12 | 19.21 |
| South Africa | 14 | 106 | 2173 | 26.5 | 135.3 | 0 | 13 | 19.59 |
| Afghanistan | 13 | 105 | 2035 | 25.12 | 132.5 | 1 | 6 | 18.96 |
| Bangladesh | 11 | 84 | 1576 | 24.62 | 123.8 | 0 | 9 | 19.89 |
| New Zealand | 17 | 139 | 2709 | 23.97 | 139.4 | 0 | 15 | 17.19 |
| Ireland | 29 | 240 | 4406 | 23.06 | 136 | 1 | 19 | 16.96 |
| West Indies | 17 | 129 | 2175 | 22.19 | 125.2 | 0 | 11 | 17.72 |
| Zimbabwe | 14 | 115 | 1991 | 21.64 | 126.9 | 0 | 11 | 17.05 |
| Pakistan | 12 | 104 | 1662 | 20.26 | 121.5 | 0 | 11 | 16.68 |
| Sri Lanka | 18 | 162 | 2304 | 17.06 | 117.4 | 0 | 8 | 14.54 |
This chart shows that a Sri Lankan player is likely to score 12 runs in 10 balls whereas an English player is likely to score 15 runs in 10 balls.
A Sri Lankan player is most likely to add 17 runs per innings in 14 balls, whereas an English player is most likely to add 29 runs in 19 balls.
During the considered period, England converted 14.6% of their innings to 50+ scores, whereas we have managed it in only 4.93%.
4 steps to make Sri Lanka Cricket great again
Much has been said (and at times done) to circumvent what appears to be an insurmountable….
In a team innings, Sri Lanka is likely to lose 8 wickets whereas England is likely to lose only 6.
Sri Lanka is most likely to score 141 for 8 wickets in an innings whereas England are most likely to score 183 for 6 wickets.
Amongst test playing teams, 141/8 is easily the lowest average team total and no other team expects to lose as many wickets as Sri Lanka.
Most likely score for each team
| Team | Matches | Innings | Predicted Runs scored P/I (Batting) | Predicted Wickets fall P/I |
| Australia | 11 | 58 | 169 | 4 |
| India | 24 | 161 | 163 | 5 |
| England | 12 | 89 | 183 | 6 |
| South Africa | 14 | 106 | 162 | 6 |
| Afghanistan | 13 | 105 | 158 | 6 |
| Bangladesh | 11 | 84 | 149 | 6 |
| New Zealand | 17 | 139 | 167 | 6 |
| Ireland | 29 | 240 | 163 | 7 |
| West Indies | 17 | 129 | 150 | 7 |
| Zimbabwe | 14 | 115 | 152 | 7 |
| Pakistan | 12 | 104 | 146 | 7 |
| Sri Lanka | 18 | 162 | 141 | 8 |
Not Enough Wickets
Since 01 January 2019, Sri Lanka bowlers (excluding run-outs) have taken 82 wickets at 32.32 runs apiece. Sri Lanka stands ahead only Pakistan in terms of bowling average in T20Is among the test playing nations.
Sri Lankan bowlers have recorded only two instances of 4 or more wickets in an innings during this period.
However, compared to the batsmen, they have done reasonably okay.
| Team | Matches | Innings | Wickets | Average | Economy | SR |
| Australia | 11 | 58 | 73 | 18.5 | 6.63 | 16.7 |
| Afghanistan | 13 | 77 | 83 | 23.5 | 7.54 | 18.6 |
| Bangladesh | 11 | 69 | 59 | 26.9 | 7.58 | 21.2 |
| India | 24 | 130 | 128 | 28 | 8.05 | 20.8 |
| Pakistan | 12 | 63 | 43 | 40.4 | 8.16 | 29.6 |
| West Indies | 17 | 99 | 101 | 26.1 | 8.18 | 19.1 |
| Ireland | 29 | 177 | 161 | 27.1 | 8.23 | 19.7 |
| Sri Lanka | 18 | 96 | 82 | 32.3 | 8.36 | 23.1 |
| Zimbabwe | 14 | 86 | 79 | 28 | 8.43 | 19.9 |
| South Africa | 14 | 80 | 94 | 25.1 | 8.6 | 17.4 |
| England | 12 | 68 | 84 | 21.9 | 8.63 | 15.1 |
| New Zealand | 17 | 96 | 99 | 28.1 | 8.66 | 19.4 |
During the considered time, Sri Lanka is the 8th best team in terms of economy rate (excluding extras). South Africa, England and New Zealand are behind Sri Lanka in terms of economy rate. However, Sri Lanka is the lowest ranked in terms of strike rate apart from Pakistan.
Sri Lanka take a wicket every 23 balls whereas South Africa does so every 17 balls, England every 15 balls and New Zealand every 19 balls.
Therefore, other teams who are behind Sri Lanka in terms of economy rate have compensated for it with a better strike rate.
Based on historical data since 01 January 2019, Sri Lanka is most likely to concede 167 runs per innings and take 5 wickets.
Most likely score against for each team
| Team | Matches | Innings | Predicted Runs conceded P/I (Bowling) | Predicted Wickets taken P/I |
| Afghanistan | 13 | 77 | 151 | 6 |
| Australia | 11 | 58 | 132 | 7 |
| Bangladesh | 11 | 69 | 152 | 6 |
| England | 12 | 68 | 173 | 8 |
| India | 24 | 130 | 161 | 6 |
| Ireland | 29 | 177 | 165 | 6 |
| New Zealand | 17 | 96 | 173 | 6 |
| Pakistan | 12 | 63 | 163 | 4 |
| South Africa | 14 | 80 | 172 | 7 |
| Sri Lanka | 18 | 96 | 167 | 5 |
| West Indies | 17 | 99 | 164 | 6 |
| Zimbabwe | 14 | 86 | 168 | 6 |
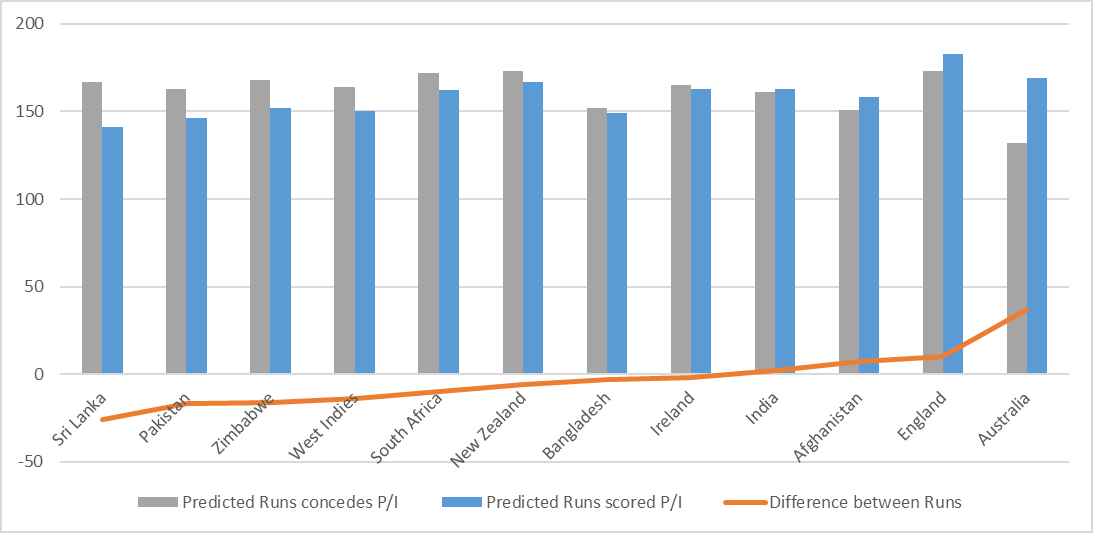
If you look at the differences between the predicted runs vs predicted runs conceded, Sri Lanka has the biggest difference between runs for vs. runs against at 26 runs. Pakistan is the second on this list.
| Team | Predicted Runs conceded P/I | Predicted Runs scored P/I | Difference between Runs |
| Sri Lanka | 167 | 141 | -26 |
| Pakistan | 163 | 146 | -17 |
| Zimbabwe | 168 | 152 | -16 |
| West Indies | 164 | 150 | -14 |
| South Africa | 172 | 162 | -10 |
| New Zealand | 173 | 167 | -6 |
| Bangladesh | 152 | 149 | -3 |
| Ireland | 165 | 163 | -2 |
| India | 161 | 163 | 2 |
| Afghanistan | 151 | 158 | 7 |
| England | 173 | 183 | 10 |
| Australia | 132 | 169 | 37 |
 Poor Results
You might have noticed that Pakistan is a close second in most of the parameters we considered but they are the world no. 1 team and we are no. 8. The results during the considered period are revealing.
Even though Pakistan is currently the no. 1 T20I team, since January 2019 – they have won only 3 games out of 12 \with a win/loss ratio of 0.375. Sri Lanka have won 4 in 18 games with a win/loss ratio of 0.333.
During this period, Australia has been the best team by far. They have won 9 games out of 11 and only lost 1. Ireland and India have won the most number of matches with 14 each.
In terms of results, Afghanistan and England come second and third. These three teams have the biggest positive difference between runs for and runs against.
| Team | Mat | Won | Lost | Tied | NR | W/L |
| Australia | 11 | 9 | 1 | 0 | 1 | 9 |
| Afghanistan | 13 | 9 | 3 | 1 | 0 | 3 |
| England | 12 | 8 | 3 | 1 | 0 | 2.666 |
| India | 24 | 14 | 7 | 2 | 1 | 2 |
| Bangladesh | 11 | 6 | 5 | 0 | 0 | 1.2 |
| South Africa | 14 | 7 | 6 | 1 | 0 | 1.166 |
| Ireland | 29 | 14 | 13 | 1 | 1 | 1.076 |
| New Zealand | 17 | 7 | 7 | 3 | 0 | 1 |
| Zimbabwe | 14 | 5 | 8 | 1 | 0 | 0.625 |
| West Indies | 17 | 5 | 11 | 0 | 1 | 0.454 |
| Pakistan | 12 | 3 | 8 | 0 | 1 | 0.375 |
| Sri Lanka | 18 | 4 | 12 | 1 | 1 | 0.333 |
Conclusion
Finally, the main conclusion we can derive from this review is that Sri Lanka are relatively poor in T20I cricket. Especially in the batting department where they are not scoring enough runs.
From a statistical point of view, Sri Lanka are behind most other countries. To win the World Cup in October (if it happens), Sri Lanka need to improve exponentially.
*Disclaimer: The views and opinions expressed in this article are those of the author’s and do not necessarily reflect the official policy or position of ThePapare.com.


